Accessing your logs
Every request that hits your Fyra site is logged. Use fyra logs to view, filter, pipe, and export them.
Open the log viewer
fyra logs launches an interactive TUI that streams new requests every 3 seconds.
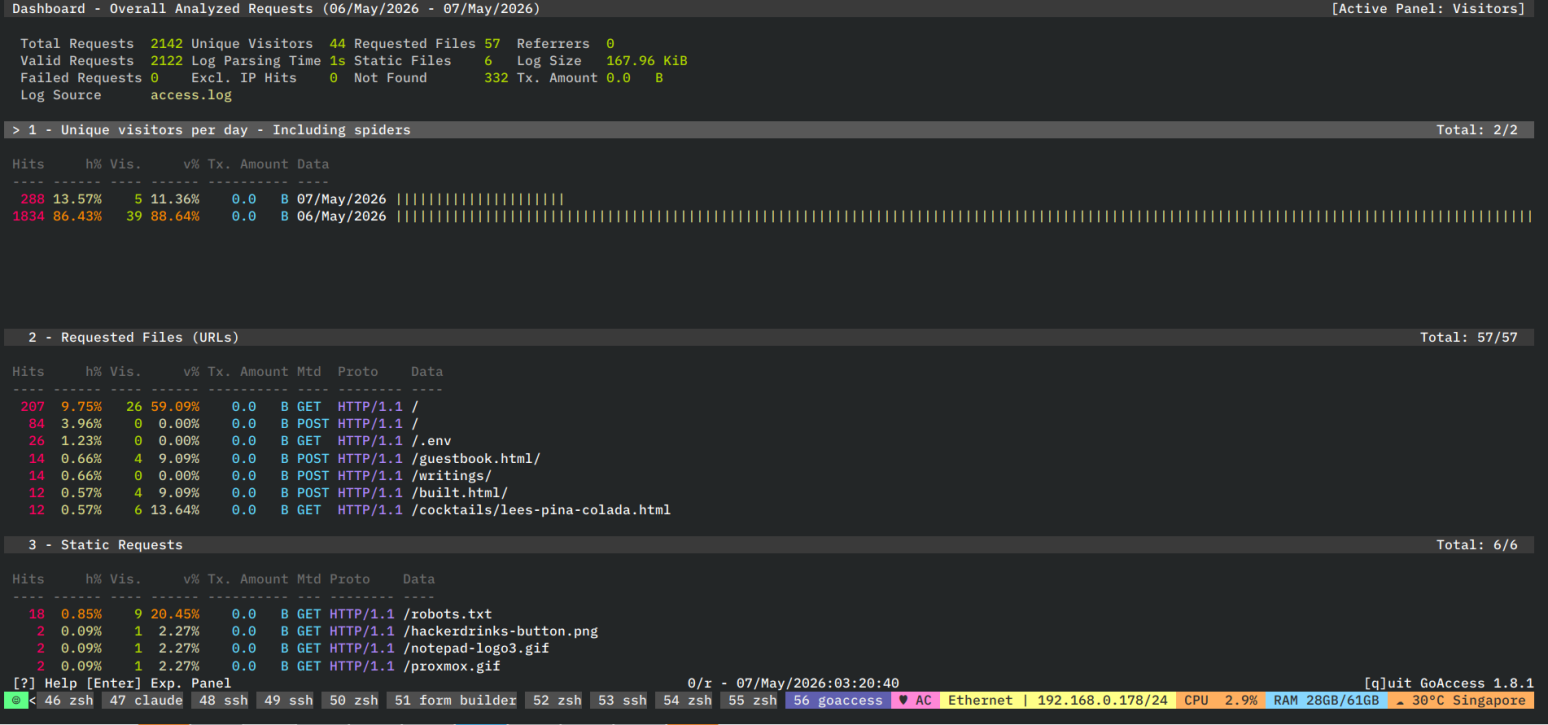
log stream
Time Status Method Path Cache IP Duration
14:23:45 200 GET /index.html HIT 1.2.3.4 5ms
14:23:46 200 GET /about.html MISS 1.2.3.4 12ms
14:23:48 404 GET /old-page MISS 5.6.7.8 3ms
Navigate the TUI
| Space | Pause or resume the live stream |
| ↑ / ↓ | Scroll through log entries |
| Enter | Inspect a selected request in detail |
| t | Toggle between UTC and local time |
| Esc | Exit inspect view or quit |
A request detail view shows the full envelope:
request detail
Timestamp: 2026-05-10 14:23:45
Hostname: app.fyra.sh
IP: 1.2.3.4
Method: GET
Path: /index.html
Status: 200
Duration: 45ms
Cache: HIT
Node: node-xyz
User-Agent: Mozilla/5.0 (Macintosh; Intel Mac OS X 10_15_7)
[Esc] back
Filter by time
Use --since with a relative or absolute timestamp.
terminal
$ fyra logs --since "1 hour ago"
$ fyra logs --since "2026-05-10 14:00:00"
Pipe logs to other tools
Use --format to emit machine-readable output. --follow keeps the stream open.
formats
table human-readable table (default in the TUI)
json one JSON object per line
clf Apache Common Log Format
combined CLF + referer + user-agent
Example: grep for 404s in CLF output.
terminal
$ fyra logs --format clf --since "1 day ago" | grep ' 404 '
1.2.3.4 - - [24/Apr/2026:14:23:48 +0000] "GET /old-page HTTP/1.1" 404 0 "-" "curl/8.7.1"
5.6.7.8 - - [24/Apr/2026:15:01:12 +0000] "GET /deleted-route HTTP/1.1" 404 0 "-" "Mozilla/5.0"
Export logs to a file
Use --output to write directly to disk.
terminal
$ fyra logs --format combined --since "1 day ago" --output logs.combined
Fetching logs...
Wrote 1,247 entries to logs.combined
No logs yet? Logs only appear after your first fyra push. Push something, then re-run fyra logs.